D3 for Author Visualization
Table of Contents
1 What is D3?
D3 (Data Driven Documents) is a Javascript
library which allows you to manipulate the DOM (or draw
directly to a canvas) based on a set of source data.
D3.js is a JavaScript library for manipulating documents based on data. D3 helps you bring data to life using HTML, SVG, and CSS. D3’s emphasis on web standards gives you the full capabilities of modern browsers without tying yourself to a proprietary framework, combining powerful visualization components and a data-driven approach to DOM manipulation. – https://d3js.org/
1.1 What can we do with D3?
Since D3 just provides the ability to easily manipulate the DOM (including SVG objects), its capabilities match those of HTML, CSS and SVG themselves - transitions, fancy text paths, 2D/3D transformations and graphical filters are all easily possible (without having to learn new technology).
For the prototype app made using D3, take a look at the demonstration examples here:
http://author-routeviz.baggale.yt/
(on-corporate network users, bless their souls, will need to look at http://author-routeviz.s3-website.eu-west-2.amazonaws.com/index.html#fe3b8f84-1fc5-463c-9fc6-c26a5fdcf543 instead)
The app parses live data from production Author and renders an interactive network graph in less than 600 lines of code (including the HTML and CSS).
1.2 The general flow of a D3 app
The core of the D3 framework is relatively minimalistic, consisting of a few different concepts from which more complex data visualisation flows can be built.
The overall flow of a D3 application is as follows:
- Get your source data (e.g. an array of Javascript objects).
- Form a D3 selection.
- Bind the data to the selection.
- Create and/or delete elements (using the
.enter()and.exit()methods) from the selection to synchronise it with the data. - Manipulate the created elements according to their bound data.
- ☕️
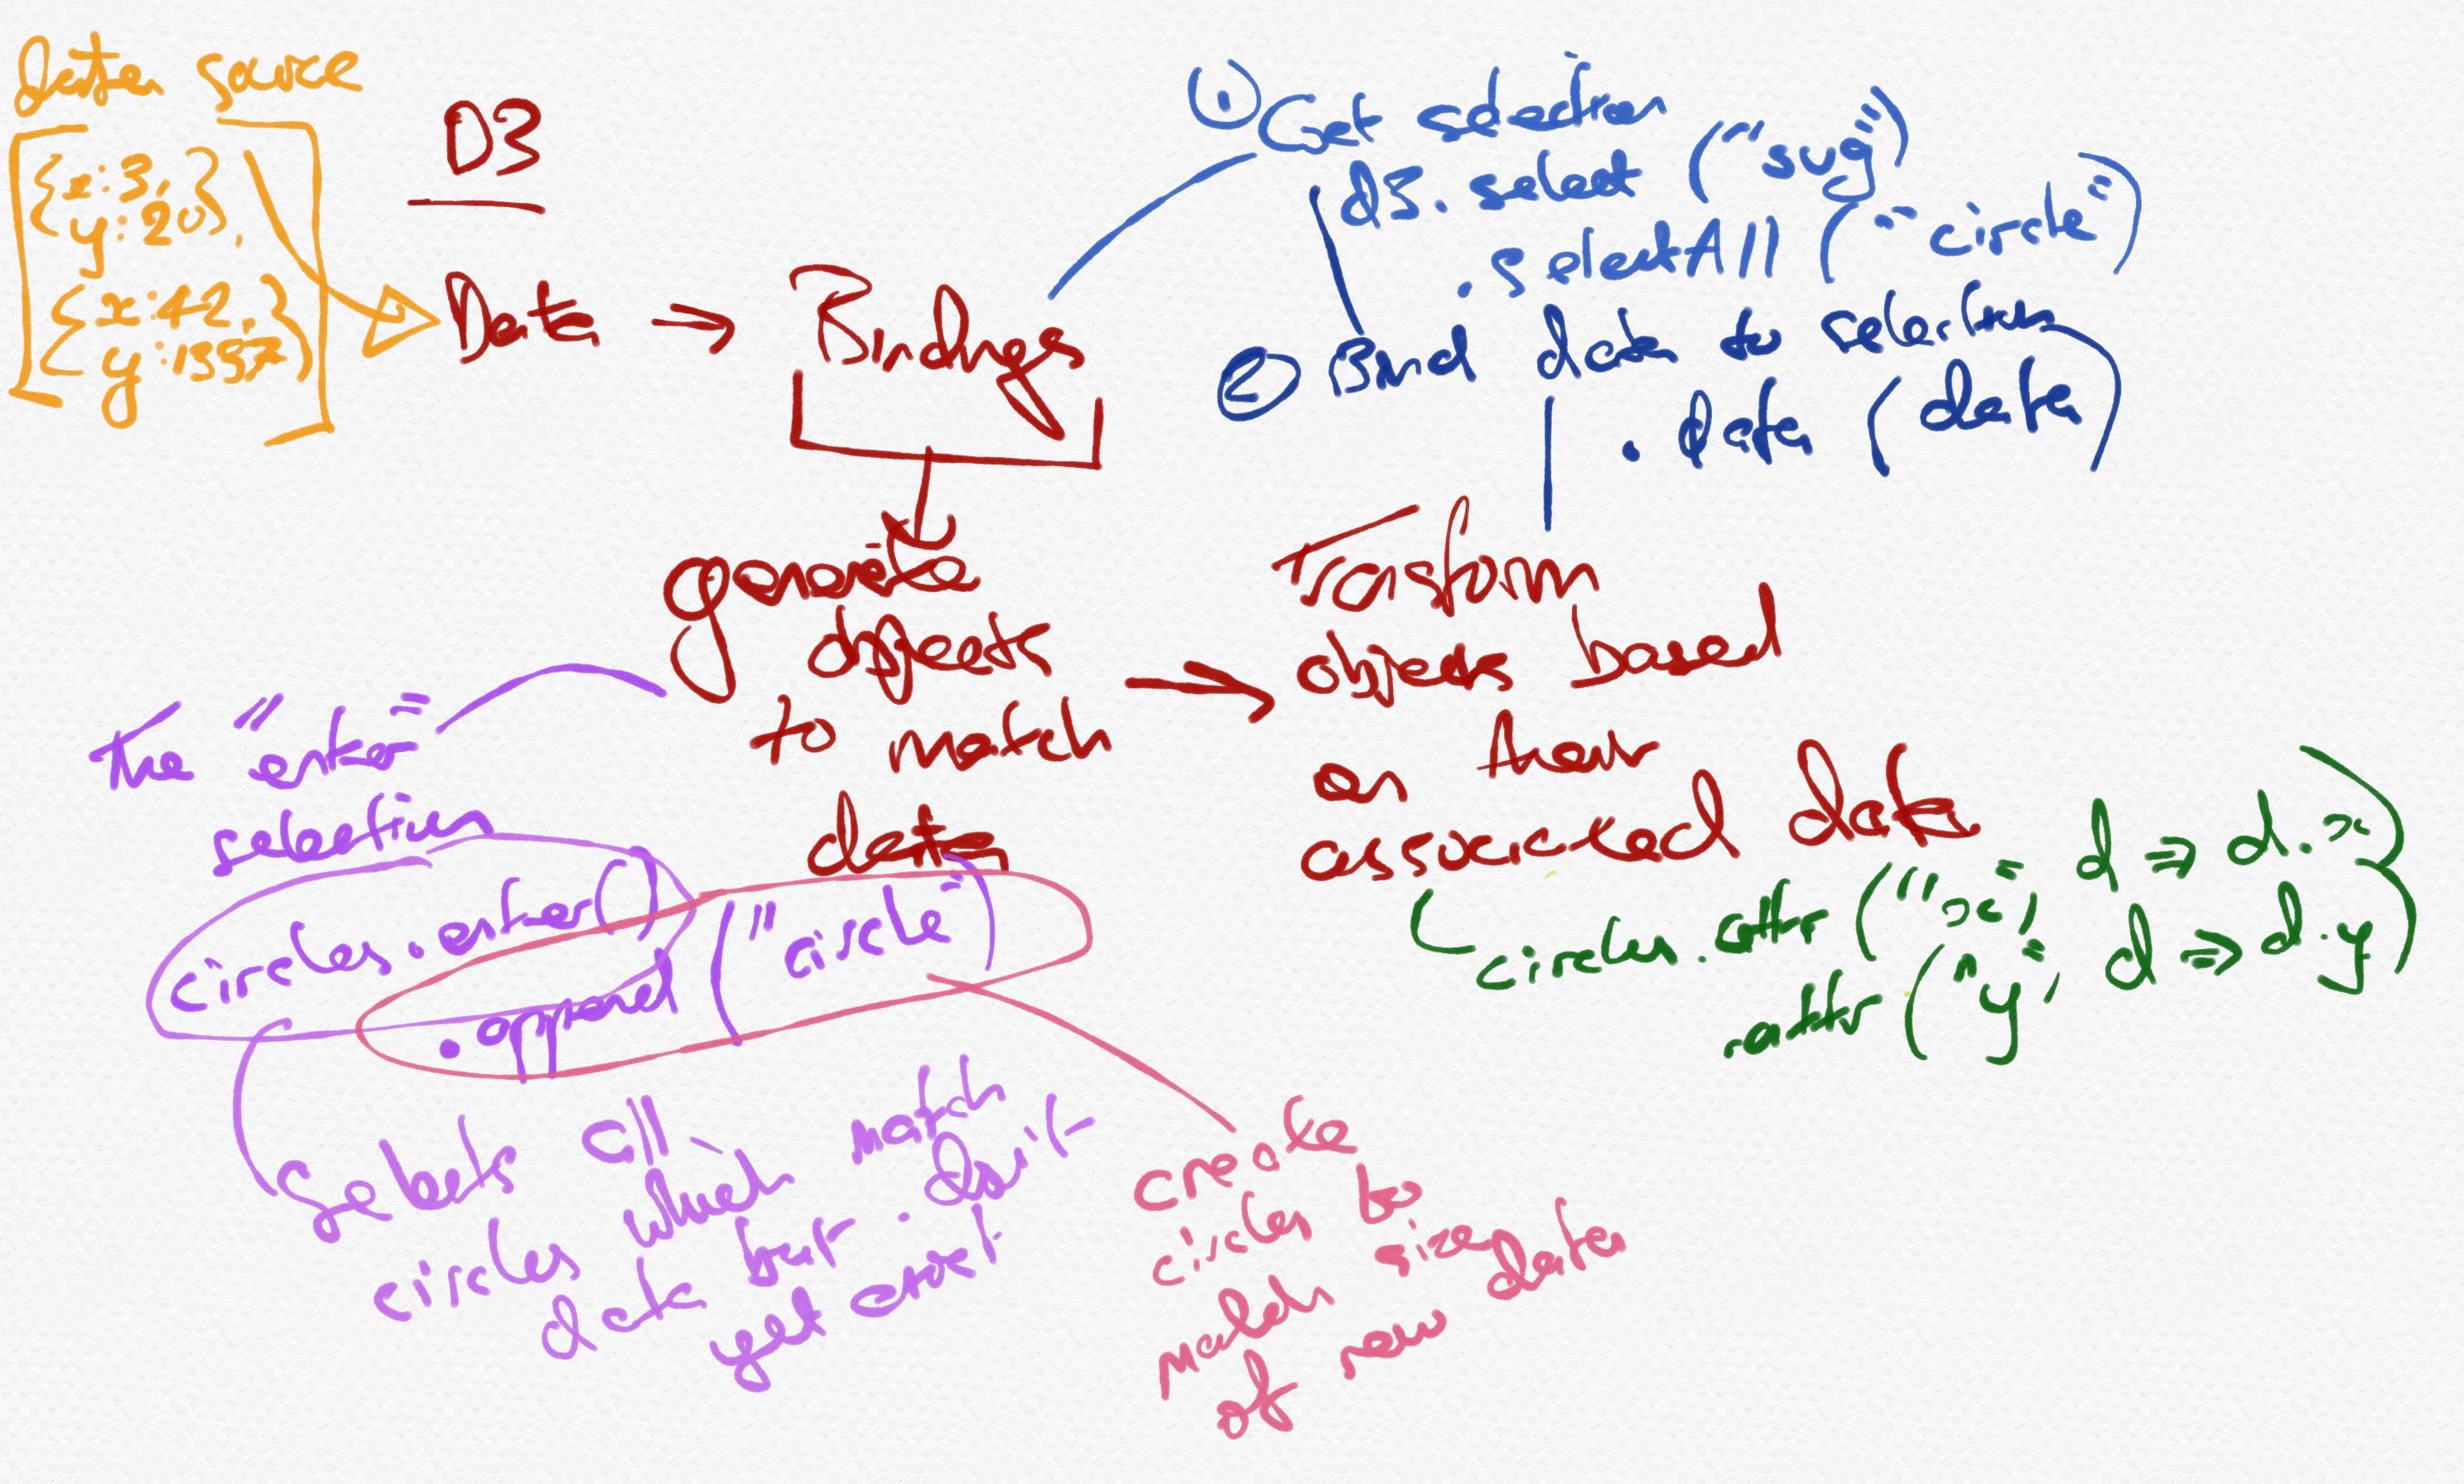
Figure 1: A lovingly drawn diagram showing the basic flow from data to presentation in d3
This code snippet shows the link lines being created
as part of the SVG diagram for the prototype routing
visualisation app - data is first bound with
.data() and then SVG lines are created with
.append("line") to match the data
representation; one line is made per entry in the
links array.
Once created, the lines are styled - their CSS classes
set using .classed() - according to their
bound data, accessible through passing in a function
accepting the data object as the second parameter of
.classed(). This is a general pattern in D3
- functions operating on objects in a selection (e.g.
.attr() to set HTML attributes) take either
a direct value to set or a callback which will be
supplied with bound data for the node.
  // Create linkage lines for each element in links data
  const linkLines = globalGroup
    .selectAll("line")
    .data(links)
    .enter()
    .append("line")
    .classed("routing", (d) => d.type === ROUTING_RULE)
    .classed("routingElse", (d) => d.type === ROUTING_RULE_ELSE);
1.3 Data structure
There’s no set way that data must be structured in order to use the core D3 functionality - it’s down to you how you want to interpret the data bound to your selection. D3 provides layouts, however, which do expect input in certain formats (specific to each layout type).
2 Layouts
D3 provides a variety of built-in functions which allow users to produce common data visualisation layouts with minimal effort.
See https://www.d3indepth.com/layouts/ for more detail & discussion of the different built-in layouts available and how to use them.
2.1 Force layout
For rendering (non-hierarchical) network graphs, the force layout is generally the layout of choice. It performs a physics simulation by applying forces to elements for a short period of time, allowing nodes in the graph to dynamically organise themselves into a suitable pattern (rather than having to specify an algorithm in advance).
The simulation can be seen in progress during the first few seconds of viewing the graph in the prototype app - see e.g. http://author-routeviz.baggale.yt/#53ec4df5-f1c8-41b2-a8b0-24772a06c0b0.
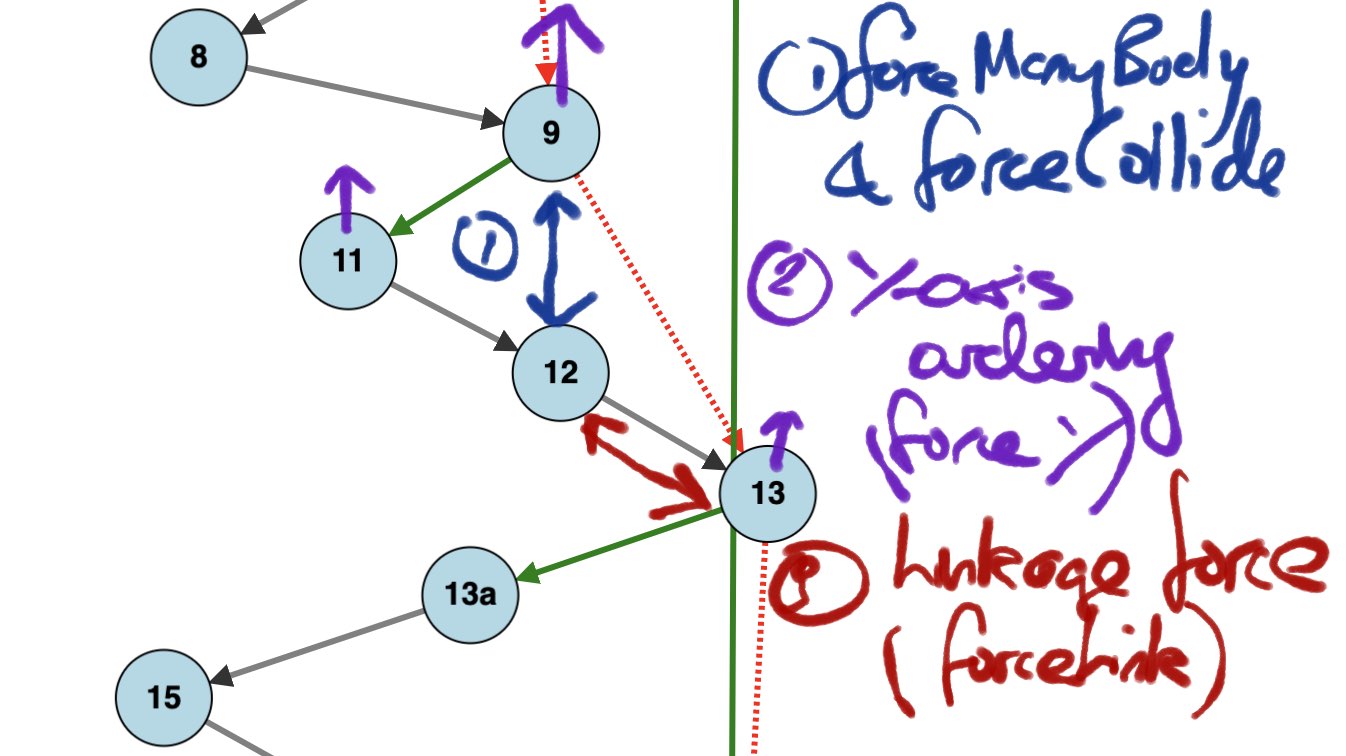
Figure 2: Three of the forces acting on nodes in the graph of the demo app
Here’s the code which creates the force layout in the prototype app:
  const simulation = d3
    .forceSimulation(data)
    .force("charge", d3.forceManyBody().strength(-10))
    .force("collide", d3.forceCollide(60))
    .force("center", d3.forceCenter(width / 2, height / 2).strength(0.75))
    .force(
      "y-axis-ordering",
      d3
        .forceY()
        .y((_, i) => i * 55)
        .strength(6)
    )
    .force("linkages", d3.forceLink().links(links).distance(100))
    .on("tick", handleTick);
The first two forces apply repulsive forces between each question page node, pushing them apart and stopping them from merging together (to improve readability / spacing in the graph).
The third center force serves to pull the
entire network into the middle of the available SVG
visible area (to prevent it from floating away from the
viewport).
The y-axis-ordering force is applied so
that earlier questions are encouraged to organise
themselves before later questions vertically in the graph
(using each element’s index; lower indicies are attracted
to lower Y values in the SVG chart).
The linkages force is applied in order to
bind question nodes together according to the routing
rules present in the questionnaire (described in
d3-friendly format in the links array).
These linkages tie question page nodes together and are
the way in which Author question routing pathways are
identified visually on the graph.
2.2 Handling updates on simulation tick
When the forceSimulation function is
called with the data array, D3 mutates the data in-place
on each tick of the simulation, giving each entry
(amongst other things) x and y
attributes reflecting their new simulated position.
To make use of this, we provide a
handleTick function passed via the
.on("tick") method of the force simulation
object which updates the positions within our SVG chart
for each node:
  // handleTick: void -> void; called per tick of physica simulation
  const handleTick = () => {
    linkLines
      .each((d) => {
        const [targetX, targetY] = vectorShorten(
          d.target.x - d.source.x,
          d.target.y - d.source.y,
          radius + arrowHeadLength
        );
        d.line = { targetX, targetY };
      })
      .attr("x1", (d) => d.source.x)
      .attr("x2", (d) => d.line.targetX + d.source.x)
      .attr("y1", (d) => d.source.y)
      .attr("y2", (d) => d.line.targetY + d.source.y);

    nodes.attr("transform", (d) => `translate(${d.x}, ${d.y})`);
  };
This is mostly a straightforward updating of positions with some vector math thrown in to reduce the length of the lines by the length of the arrowhead markers used within the app (otherwise the arrow heads extend into the circles for the question nodes).
NB1 - The x1 and
x2 are SVG attributes specifing the start
and end points of the lines respectively (ditto for
y1 & y1).
NB2 - The “nodes” are the question page nodes, which are implemented with SVG groups (as they consist of a circle and text which need to move together); for this reason we have to use a 2D transform to move them instead of specifying positional attributes.
3 Data representation
D3’s force layout places no constraints on the data
representing the nodes in the network graph - these can be
specified however we like. In the prototype app, the data
for the question page nodes is an array of Javascript
objects specifying question page alias,
title, etc. These attributes can thereafter be
read by the presentation code and used to e.g. create text
elements with the alias (as used within the
circles for each question page node).
The force layout does require that the links that
you specify correspond to an array of objects containing
source and target attributes
which refer to indicies in the data array:
[
    {source: <sourceindex>, target: <targetindex>},
]
We will require code to translate Author JSON into two
separate arrays: one data array containing
relevant information for each visible node in the graph
(e.g. question pages) and one links array
describing which indicies of the data nodes
link to which.
I’ve written some code to perform this process which can be viewed in full (with comments) here: survey-transform.js.
4 Note re: app architecture
This app should be quite possible to achieve as a static website - there’s no need for any serverside processing.
Would make the “feature activated from eQ Author”
criteron on the MVP document easy to accomplish; in the
prototype app, the questionnaire ID is passed in using
location.hash - it then fetches the
questionnaire directly from prod (using a CORS proxy for
now until we add the requisite headers to Author API to do
it directly). We could just have a button / link in Author
which directs users to
http://<urlofservice>/#<questionnaireID>
Would make deployment super simple too (and super cheap to “operate”) - can live in an S3 bucket; deployment is a simple upload / sync.
5 Tutorials
Some useful tutorials: